service-mesh-training
Lab 03, Exercise 02: Downstream Connections
Objective: Create a visualization of downstream connections.
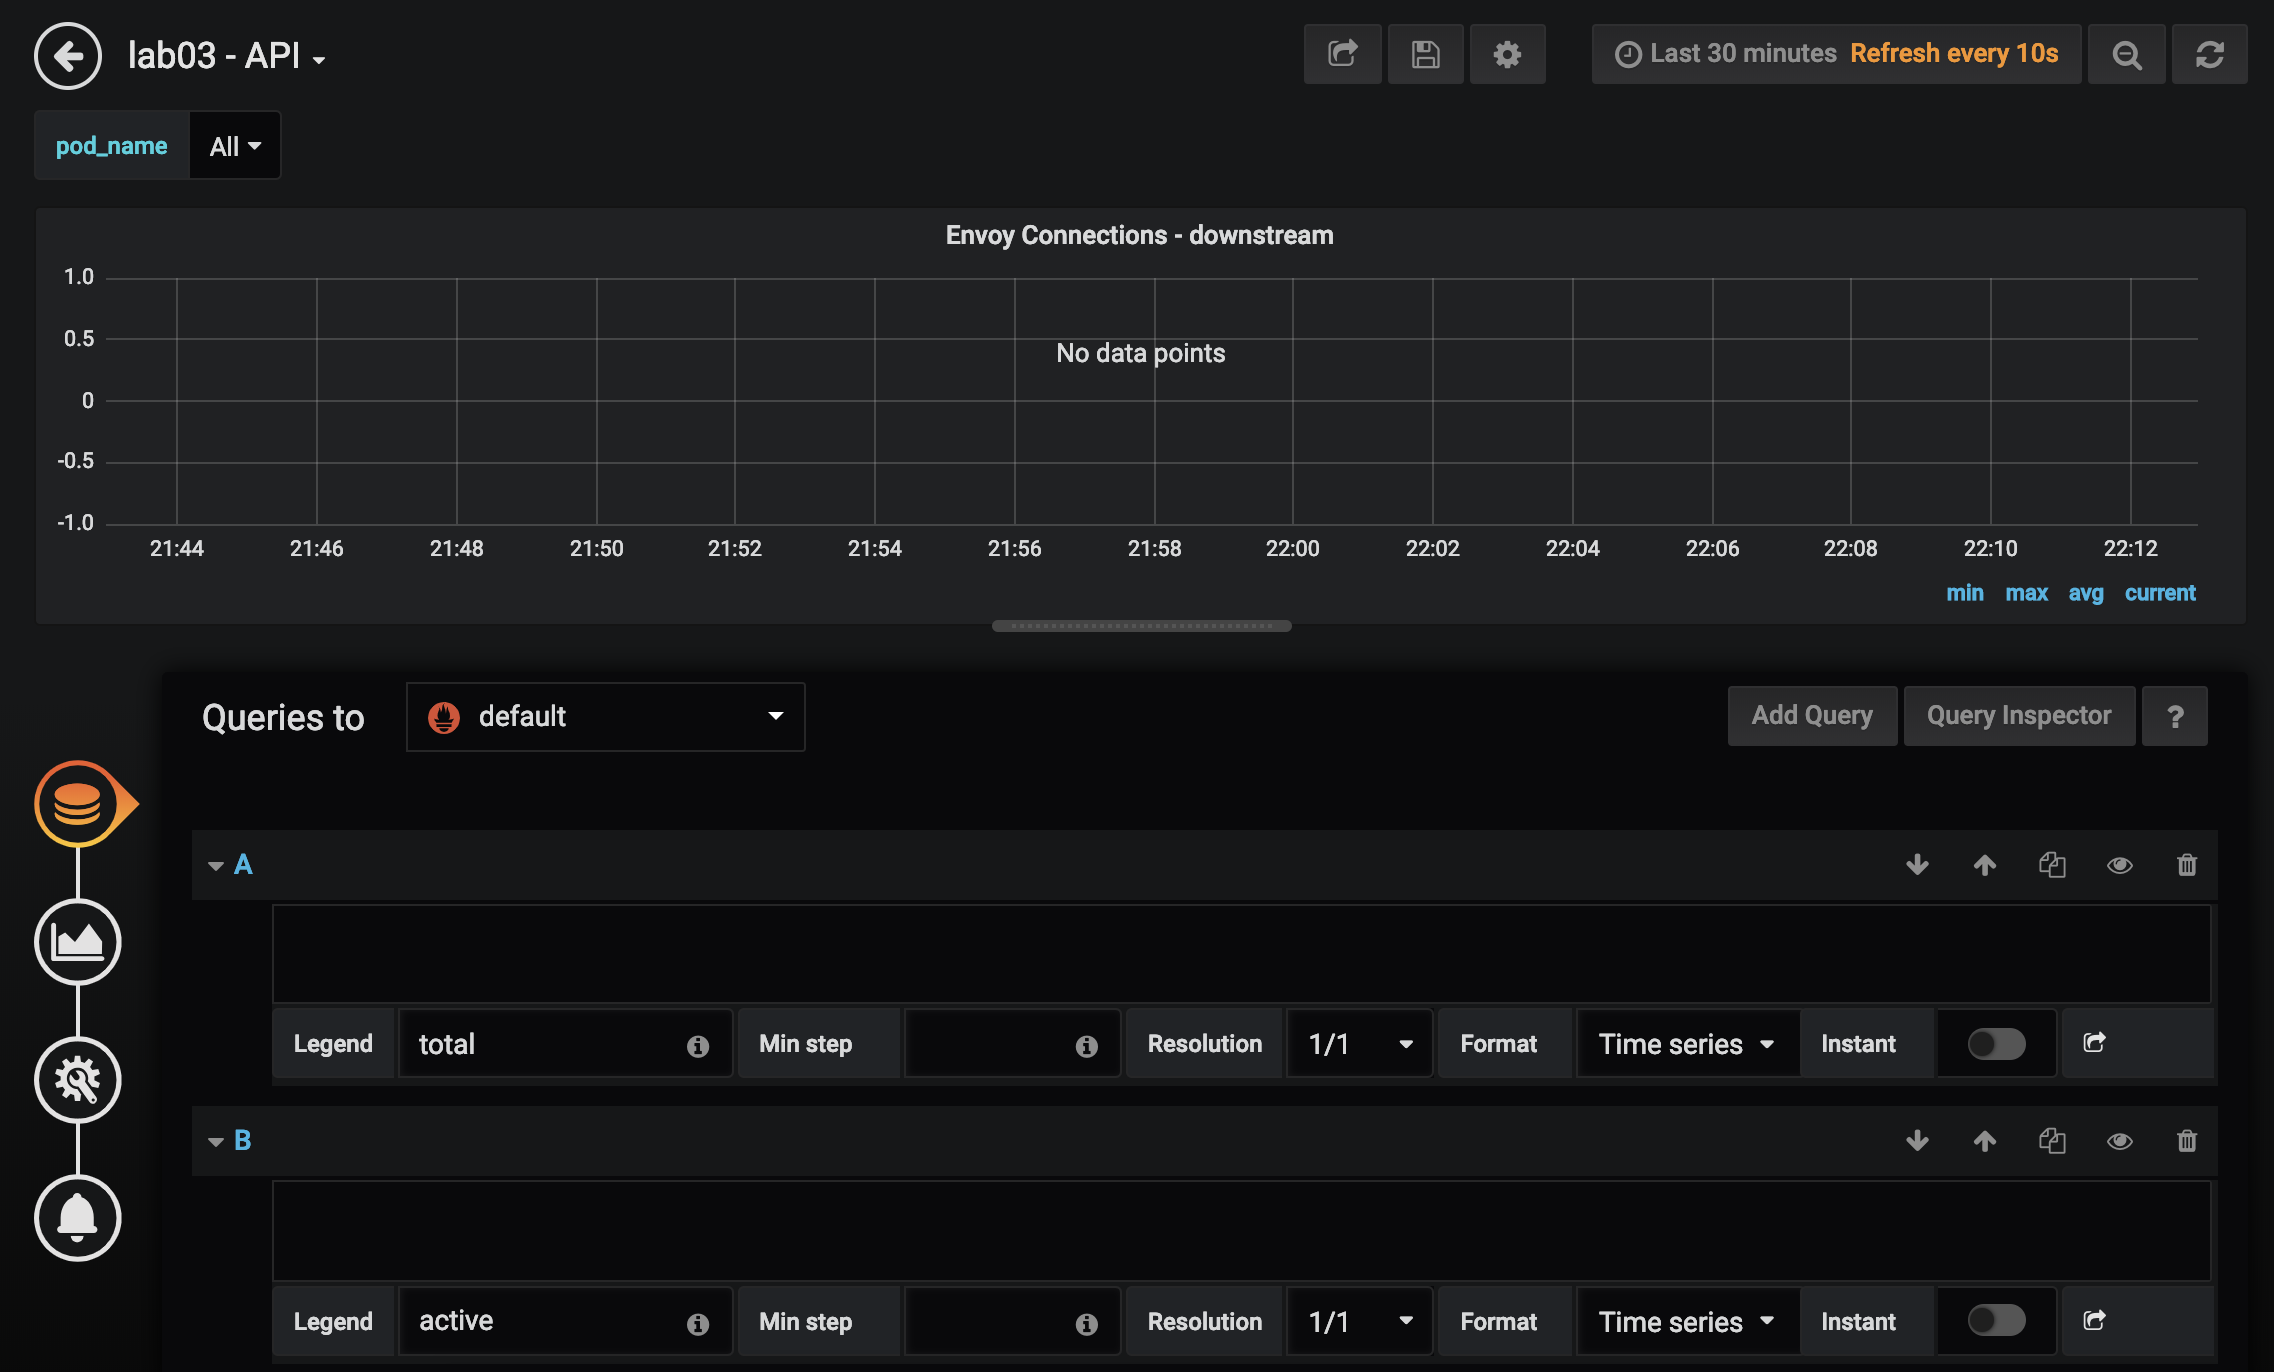
Go to Grafana tab in Instruqt. Open lab03 - API dashboard.

Edit Envoy Connections panel. You’ll notice there are empty queries with pre-populated legends. You’ll complete these queries in each of the next steps.

Step 1: Total connections
In query with legend total:
sum(increase(envoy_http_downstream_cx_total{envoy_http_conn_manager_prefix="ingress_api", name=~"^$pod_name$"}[1m]))
Step 2: Active connections
In query with legend active:
sum(increase(envoy_http_downstream_cx_active{envoy_http_conn_manager_prefix="ingress_api", name=~"^$pod_name$"}[1m]))
Step 3: Remote connections destroyed
In query with legend destroy-remote:
sum(increase(envoy_http_downstream_cx_destroy_remote{envoy_http_conn_manager_prefix="ingress_api", name=~"^$pod_name$"}[1m]))
Step 4: Local connections destroyed
In query with legend destroy-local:
sum(increase(envoy_http_downstream_cx_destroy_local{envoy_http_conn_manager_prefix="ingress_api", name=~"^$pod_name$"}[1m]))